Markov chain Monte Carlo sampling
In a previous posting I explained Bayes theorem for splitting up joint probabilities Pr(x,y) into component pieces (either Pr(x│y) Pr(y) or Pr(y│x) Pr(x)), which leads onto a very neat way of drawing sample pairs of vectors (x,y) so that they have the correct joint probability Pr(x,y). This is called Markov chain Monte Carlo (MCMC) sampling.
Firstly, notice that the pair of vectors (x,y) forms a single (higher-dimensional) vector. In the description below this partitioning of the single vector into a pair of vectors (x,y) is done in whatever way is convenient. This will be explained below.
Start off by supposing that someone hands you a pair (x,y) that is known to have joint probability Pr(x,y). You can use this to generate another pair (x,y) that also has joint probability Pr(x,y). Here is how you do it:
- Use Bayes theorem to split Pr(x,y) as Pr(x,y) = Pr(x│y) Pr(y), where Pr(y) ≡ ∫dx Pr(x,y). This tells you that Pr(x│y) = Pr(x,y) / ∫dx Pr(x,y) which will be used below.
- Draw a sample vector (call it x´) from the Pr(x│y) computed above, and make this the new value of x. Note that you do not need to know Pr(y) to draw this sample. Here I assume that it is easy to draw an x-sample from Pr(x│y) (e.g. x is low-dimensional) but it is difficult to draw an (x,y)-sample from Pr(x,y) (e.g. (x,y) is high-dimensional) which is the sampling problem that we want to avoid.
- The joint state is now (x´,y). Its joint probability is Pr(x´│y) Pr(y), where Pr(x´│y) has the same functional dependence on x´ as Pr(x│y) has on x, by construction.
- Use Bayes theorem to join these together to obtain Pr(x´,y) = Pr(x│y) Pr(y), where Pr(x´,y) has the same functional dependence on x´ as Pr(x,y) has on x, by construction.
The partitioning of the whole vector into a pair of smaller vectors (x,y) can be done in any way, and as long as it is easy to draw a sample of x from Pr(x│y) then another (x,y) (different x, same y) can be generated as described above. This process can be iterated (choosing a different partitioning of the whole vector at each iteration) to generate a whole sequence (or Markov chain) of vector samples (hence the name "Markov chain Monte Carlo" sampling) all of which have the correct joint probability. The main caveat is that the sequence is correlated, because each vector in the sequence has a "memory" of the past history of the sequence.
Note that the above algorithm does not work if the initial pair of vectors does not have joint probability Pr(x,y). However, under fairly mild assumptions (i.e. ergodicity), the algorithm will generate a sequence of vectors whose joint probability settles down to Pr(x,y) after an initial convergence period, after which the assumptions of the above algorithm are satisfied.
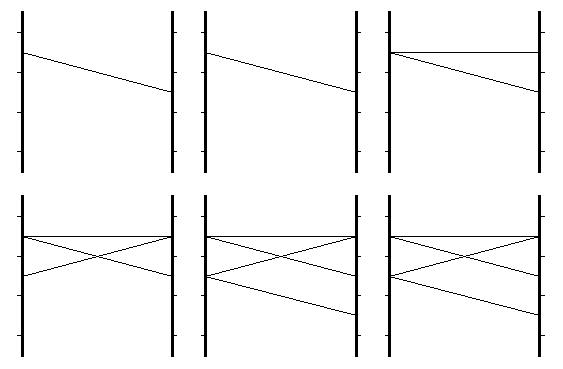
The diagrams below show how a typical MCMC sequence building up. This uses the same Pr(x,y) and diagrammatic notation as was used in my posting on Bayes theorem here, and was in fact how I generated the diagrams there. A different random seed has been used here. Each of x and y has 3 possible states, so (x,y) has 9 (=3*3) possible joint states.
The first diagram shows the first 6 steps of the MCMC sequence, where the initial state (3,2) is at the top left, and successive states are shown in the graphics as read from left to right then top to bottom. After 1 MCMC update the state is unchanged (that is the draw of the random numbers), then after 2 MCMC updates the y part of the state updates so that the state is (3,3), then at the next step the x part of the state updates so that the state is (2,3), then the y part of the state updates so that the state is (2,1), then the next update can't be inferred from the diagram because it repeats a state that occurred earlier. The source of the correlations between successive MCMC samples is clear because each update moves only one end of the line in the graphic.
The diagram below shows the same as the diagram above except that 25 MCMC updates elapse between each graphic. Also, for visualisation purposes, the end points of each line representing a joint state are vertically jiggled a little bit so that they don't all fall on top of each other.
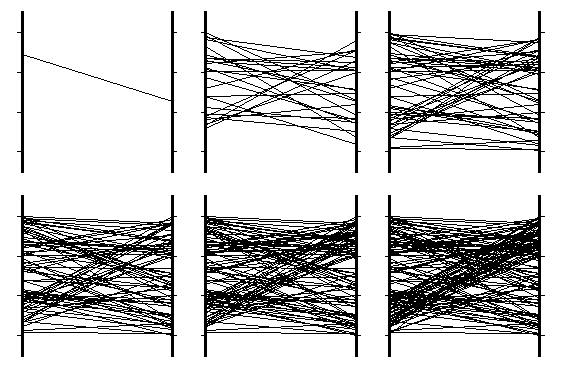
This MCMC approach to sampling is very powerful, and with some ingenuity it can be used to draw samples from any joint probability, but always with the caveat that the sequence is correlated.
posted by Stephen Luttrell @ 8:26 pm
![]()

0 Comments:
Post a Comment
<< Home