Vector quantiser simulation
The aim here is to show how to write the code to implement the training of a vector quantiser (VQ) as described in my earlier posting here. The code is implemented as a discrete time dynamical system (DTDS) as described in another of my earlier postings here.
Call in some graphics packages.
Needs["Graphics`Graphics`"];
Needs["Graphics`MultipleListPlot`"];
Needs["DiscreteMath`ComputationalGeometry`"];
Define the size of the training set (i.e. the number of vectors sampled from the input probability density) and the number of code indices to use (i.e. the size of the "code book").
numtrain=100;
numcodes=20;
Define a function nn to compute the index of the vector (in a list of reconstruction vectors r) that lies closest (i.e. is the "nearest neighbour") to an input vector x. This is the encoded version of the input vector.
nn[x_,r_]:=Position[#,Min[#]]&[Map[#.#&[x-#]&,r]][[1,1]];
Read this definition from the inside out:
- Map[#.#&[x-#]&,r] computes the list of squared distances between the input vector x and each vector in the list of vectors r (the "code book").
- Position[#,Min[#]]&[...][[1,1]] computes the position in the list of the smallest of the above squared distances.
Define a function y to build a list of the codes corresponding to the whole set of training data at time step t.
y[t_]:=(y[t]=Map[nn[#,r[t]]&,data[t]]);
Read this definition from the inside out:
- data[t] is a function that returns the training set at time t.
- Map[nn[#,r[t]]&,data[t]] computes the list of encoded versions of all of the input vectors in the training set.
- y[t]=... memorises the result of the above step.
Define a function datay to build a list of the training data that maps to each code at time step t.
datay[t_]:=Table[Cases[Transpose[{data[t],y[t]}],{x_,i}:>x],{i,numcodes}];
Read this definition from the inside out:
- Transpose[{data[t],y[t]}] builds a list of pairs of corresponding input vectors and their codes.
- Cases[...,{x_,i}:>x] extracts the subset of data vectors that are paired with code i.
- Table[...,{i,numcodes}] builds a list of the above subsets for all codes.
Define a function r to compute the updated list of reconstruction vectors at time step t.
r[t_]:=(r[t]=Map[If[Length[#]>0,Apply[Plus,#]/Length[#],Table[Random[],{2}]]&,datay[t-1]]);
Read this definition from the inside out:
- Apply[Plus,#]/Length[#]&[datay[t-1]] computes the updated list of reconstruction vectors from the list of subsets of training data that maps to each code at time step t-1.
- If[Length[#]>0,...,Table[Random[],{2}]] protects the above code from a possible error codition when the length of a sublist is zero (i.e. none of the training vectors map to a particular code).
- r[t]=... memorises the result of the above step.
Define the value that the r function returns at time step 0. This initialises the reconstruction vectors.
r[0]=Table[Random[],{numcodes},{2}];
Define a function data that returns the set of training data at time step t. This is a fixed set (for all time steps) of 2-dimensional vectors uniformly distributed in the unit square.
data[t_]=Table[Random[],{numtrain},{2}];
Define the number of training updates. Typically, this VQ converges in far fewer updates than the 20 chosen.
numupdates=20;
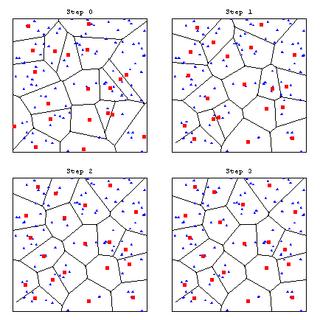
Display the training of the reconstruction vectors.
vqgraphics=Table[MultipleListPlot[data[t],r[t],PlotRange->{{0,1},{0,1}},AspectRatio->1,Frame->True,SymbolStyle->{RGBColor[0,0,1],RGBColor[1,0,0]},SymbolShape->{PlotSymbol[Triangle],PlotSymbol[Box]},PlotLabel->"Step "<>ToString[t],FrameTicks->False],{t,0,numupdates}];
[GRAPHICS OMITTED]
Display the encoding cells corresponding to the reconstruction vectors.
codecellgraphics=Table[DiagramPlot[r[t],PlotRange->{{0,1},{0,1}},LabelPoints->False,PlotLabel->"Step "<>ToString[t],Frame->True,FrameTicks->False],{t,0,numupdates}];
[GRAPHICS OMITTED]
Display all of the graphics together.
MapThread[Show[#1,#2]&,{codecellgraphics,vqgraphics}];
[GRAPHICS OMITTED]
Display the first few update steps to show the convergence to an optimum VQ. This example has been chosen deliberately so that it converges fast. It usually takes more than 3 update steps for the optimisation of this VQ to converge.
DisplayTogetherArray[Partition[Take[MapThread[Show[#1,#2]&,{codecellgraphics,vqgraphics}],4],2]];
Because this DTDS implementation of the training of a VQ memorises the values returned by the y and r functions you need to erase these values using y=. and r=. before retraining the VQ.


